Updated Monthly
Streets with the Most Closings in America
Brandmarch tracks tenant openings and closings across shopping centers, high streets, and retail corridors in the U.S. These rankings show the properties with the most tenant activity or the most tenants per category.
Date updated Oct 18, 2026•Tracking 30,387 properties
Powered by Brandmarch's proprietary recommendation engine
Openings
307
15.9%vs prior 12 months
Closings
165
42.9%vs prior 12 months
Net growth
+142
86.8%vs prior 12 months
Active properties
124
13.3%vs prior 12 months
| # | Property | Type | Openings | Closings | Net | Coming soon | Total Tracked Tenants | GLA (SF) | Trend |
|---|---|---|---|---|---|---|---|---|---|
| 1 | 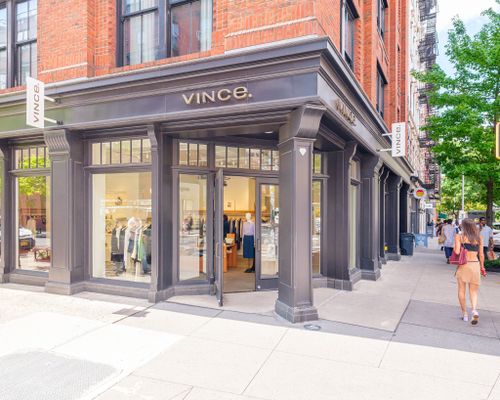 SOHO New York City, NY | Street | +19 | -12 | +7 | +2 | 179 | — | |
| 2 | 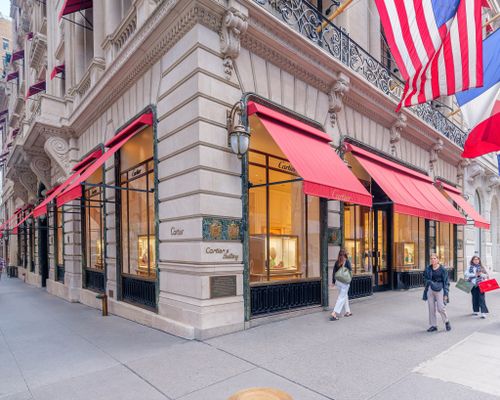 5th Avenue - Midtown New York City, NY | Street | +4 | -6 | -2 | 0 | 107 | — | |
| 3 | 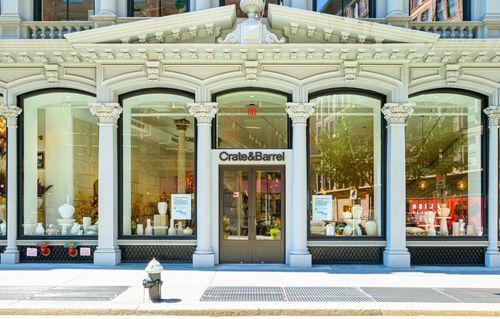 Broadway: 14th-23rd New York City, NY | Street | +1 | -5 | -4 | 0 | 45 | — | |
| 4 | 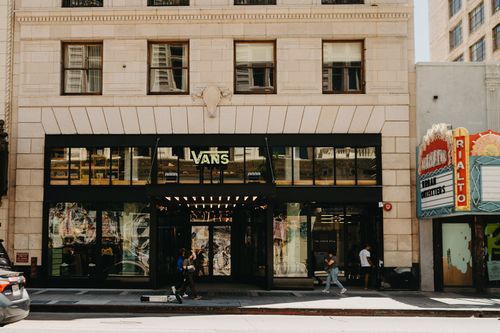 Downtown Los Angeles Los Angeles, CA | Street | 0 | -5 | -5 | +1 | 38 | — | |
| 5 | 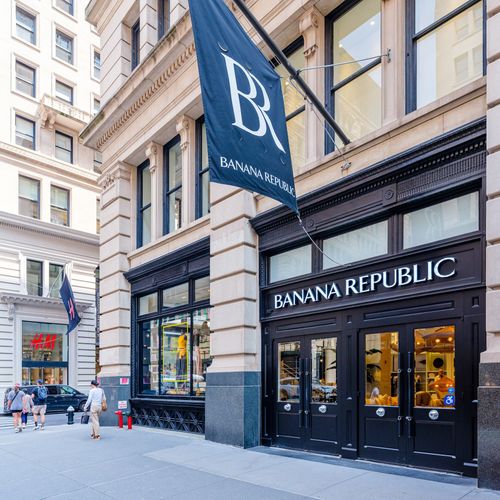 Flatiron District New York City, NY | Street | +13 | -5 | +8 | +3 | 215 | — | |
Get Your Property Sponsored Get top placement so brands and brokers scouting new locations see your property first. See how it works | |||||||||
| 6 | 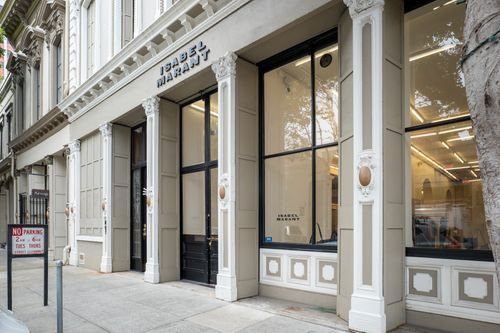 Jackson Square San Francisco, CA | Street | +1 | -5 | -4 | 0 | 53 | — | |
| 7 | 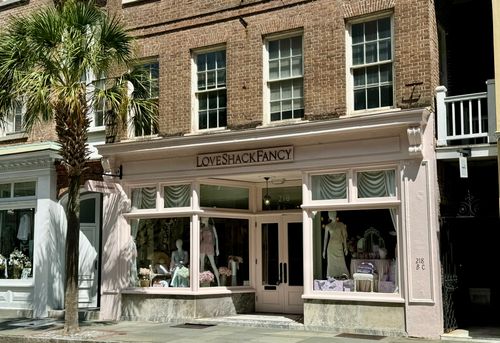 King Street Charleston, SC | Street | +7 | -5 | +2 | 0 | 77 | — | |
| 8 | 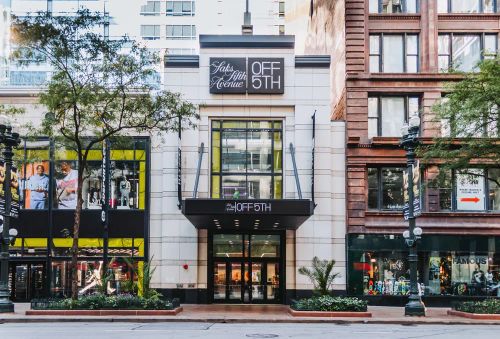 State Street Chicago Chicago, IL | Street | +3 | -5 | -2 | +3 | 96 | — | |
| 9 |  Rush Street Chicago, IL | Street | +4 | -4 | 0 | 0 | 57 | — | |
| 10 |  Times Square New York, NY | Street | +2 | -4 | -2 | +3 | 128 | — | |
Unlock the full Most Closings leaderboard
Free to get started — upgrade to Intelligence tier for $49/month to see full rankings